The simple formula that describes wind speeds: Advanced wind model leverages CISL resources
by Shira Feldman
“The proposed simple formula—maybe it’s not very precise, but it’s good enough for a lot of applications. Demanding excessive precision in a model is often counterproductive, right? It also has to be useful." —Charles Meneveau, co-author

Landscape on a windy day. Photo credit: Antanasc.
Using CISL computing resources, a team of researchers at Johns Hopkins University has created a new model for the wind within the lowest layer of our atmosphere, the atmospheric boundary layer (ABL). This work was published in the March 2024 issue of Boundary-Layer Meteorology.

Charles Meneveau, study co-author and interviewee.
Charles Meneveau, the paper’s co-author and a faculty member at the Johns Hopkins Whiting School of Engineering (as well as at the Ralph O'Connor Sustainable Energy Institute at Johns Hopkins), met with CISL News to discuss this research’s impact. He stated:
“In this paper—made possible with the very valuable, very user-friendly, and very powerful computer resources at NSF NCAR—we came up with simple formulas that condense complex data to establish a new, useful model of vertical profiles of velocity."
The team simulated extremely complicated atmospheric flows over numerous different conditions, then analyzed the data to ultimately capture "simple formulas" that condense and synthesize many of their important learnings.
In so doing, the team has generated nothing less than a new analytical model of the “vertical profile of wind velocity,” that is to say, a simple formula that can predict with credible accuracy the time average of the chaotic movements of the wind at various heights above the ground. (As Meneveau indicated, NSF NCAR provides access to powerful computing resources to NSF-funded Earth system science researchers, offering small allocations continually and reviewing large-scale proposals twice per year; see University Allocations for more details.)
The implications are far-reaching: the model can be applied to better interpret atmospheric field measurements, to develop better design tools for wind farms, models for contaminant dispersion, and more accurate surface flux boundary layer parameterizations used in weather forecasting and climate models. Another important application of this type of modeling is to assist in the expansion of renewable wind energy. Said Meneveau:
“In 20 years we could be deriving half of our electricity from wind power. There’s no real reason why that shouldn’t be possible.”
To Meneveau’s way of thinking, “wind energy and solar energy are about 50/50 in terms of potential.” He elaborated on this point: “If you add the two together you gain. Typically when the sun shines a lot, there's not that much wind. At nighttime the winds are stronger but there's no sun. The two together make a wonderful symbiosis and supplement each other.”
A Key Insight
Scientists have grappled for decades with the challenge of accurately modeling wind within the ABL, with previous attempts oversimplifying the complex interactions at play. With the ability to test hypotheses immediately with numerical simulations from the supercomputer Cheyenne (via NSF NCAR and CISL), the Johns Hopkins team was able to explore a different approach, recognizing that the ABL is not a single entity but rather a two-layered system. In the surface layer just above the ground, friction from trees, buildings, and uneven terrain affects the wind directly. Above that, in the Ekman layer, the Earth's rotation plays a significant role, causing the wind to change direction as one goes higher up—an effect called the Ekman spiral.
The model combines existing theories for each layer, but also introduces a new factor: the influence of ground cooling rate, especially relevant during nighttime when the atmospheric boundary layer is stably stratified. By accounting for all these variables, the new model provides a unified picture of wind behavior, including phenomena that were previously difficult to model mathematically, such as low-level jets. The resulting model performs more accurately than previous models, and compares very favorably with the high-fidelity simulation data obtained at CISL over many conditions.
Given the importance of these high-fidelity simulations to the research, Meneveau shared more thoughts about this underlying tool, modeling turbulent flows using computational fluid mechanics. (“Fluids” in the general context means liquids or gases, but refers to air in the present research context.)

Ghanesh Narasimhan, the study's lead author.
“How do fluids move?” he asked rhetorically. “They move in very complicated ways, and they have traditionally been very difficult to describe using easy mathematical solutions. It turns out that large-scale computer simulations are actually able to simulate these very complicated flows. We solve F=ma [Newton’s second law of physics, stating that the force acting on an object is equal to the object’s mass times the object’s acceleration]. That's what people learn in basic physics when aiming to describe the simple motion of point particles or a falling apple. But here we solve that equation many billions of times, at billions of different places in the flow. What we observe are very complicated eddying motions in fact replicating features of the chaotic nature expected of turbulent wind motions.” He added:
"The ability to model chaos, or to understand it in a mathematical way, has always fascinated me. One big thing over the last 40 years—it's now possible for us to mimic turbulent flows very realistically on computers."
“These simulations, called 'large eddy simulations,' on powerful computers, give you fluctuations that are quite realistic. They simulate the turbulent chaotic vortices. They’re hugely complicated. They oscillate and fluctuate. They look very realistic—just imagine moving clouds that swirl around and so on," he said.
The Pursuit of Simplicity
Meneveau identified a problem with these large, sophisticated computer models: “One of the big challenges is actually what to do with all this data, because we get a very complicated solution that depends on time. But what do we do with that? How do we handle it?” In contrast to all this vast and detailed complexity, he added, easy mathematical formulas that encapsulate simply the average values of wind velocity “are still very useful when we design wind farms, predict the weather, or have to do anything real.”
He continued: “To understand what we're after—it’s really a description of the average velocity profile if you look at different heights in the atmosphere. Near the ground it's very low, and then as you go further up, the mean wind picks up, right? And it gets faster and faster. But it actually isn't always in the same direction—at different heights, the mean velocity veers in different directions. So, we were primarily interested in simply the average, so profiles of mean velocities as a function of height.”
These are measurements that scientists have been obtaining in the field for many decades. Atmospheric scientists place numerous sonic anemometers—instruments for measuring the speed of wind—on meteorological towers up to 300 meters tall. Sensors are placed at various heights to obtain real-time wind speed measurements. These can then be averaged over, say, 20 minute time windows to obtain "20 minute time averages" of the wind speeds. “From the simulation, we too can measure wind speeds everywhere, but then we still need to simplify it and average it and find the mean distribution, like a typical velocity profile. This mean velocity changes as a function of height, but also different provile shapes are obtained depending on conditions such as ground cooling parameters.”
He continued: “What we were able to do with the simulations is to change these parameters, see how the flow changes, understand why that is, and then build these insights into relatively simple analytical formulas, which is really the outcome of that paper. In the end, those are simple mathematical formulas that represent a vertical profile of mean velocity, and these reduced models can be quite useful.”

Study co-author Dennice F. Gayme.
The search for "reduced-order models" for complex systems is an area of particular interest to the study's other co-author, Dennice F. Gayme of the Johns Hopkins Whiting School of Engineering.
Reduced models are by their very nature simplified and precise, but only up to a point. A formula that is “not precise but good enough” is intriguing, but also a bit bewildering. In a research field focused strongly on accuracy and correctness, what does this mean?
Meneveau explained his thinking further: “Precise is a dangerous term, right? Because if you look at it from far away, it's quite accurate, but not so when you start looking at the details. But maybe you don't care about those details. So I think it's probably not correct to say a simple formula is ‘not precise.’ It depends on the context. British statistician George E. P. Box said, ‘all models are wrong, but some of them are useful.’ That's a good quote. Because when you develop a model, you're representing something complex in more simple terms, so now it also has to be useful." He added:
“Not all models are useful. Some are precise and not useful, and some are imprecise and not useful. Those are the ones we don't want. I'd say that our model is precise only to a point, but it will prove quite useful.”
Modeling Multiple Cases
Meneveau stressed the importance of modeling different regimes of atmospheric conditions: "We couldn't just do it for one condition.”
The team first investigated atmospheric flow under neutral conditions, but then moved on to include stably stratified conditions—or when the ground is cooler than the air—which often occurs at night: “let’s say you have no cloud cover, so beautiful day, and a black sky with stars.” These conditions inhibit turbulence and tend to “become more like laminar flow,” when air layers slide horizontally without much mixing, potentially leading to fog and frost—“very bad for the California vineyards.” Stably stratified conditions alter the wind patterns and change the vertical distribution of velocity at nighttime. To learn more, the team examined this regime with varying degrees of surface cooling in their simulations.
As Meneveau had explained, this wind research was largely motivated by the need to improve wind farm modeling for better predictions of energy production across various weather conditions throughout the day and year. This understanding of wind flow can then help optimize wind farm design, such as determining the best spacing between turbines to maximize energy yield over time.
“If you want to predict the average yield of your wind farm, you don't just care about a single time of day,” he said. “You also care about nighttime, daytime, and days during wintertime, summertime. The developed model of mean wind velocity allows us to make a best guess of the yield of a wind farm over an extended period of time.”
Real-World Impact
Meneveau spoke of wind energy as a major emerging industry, using large turbines to convert wind kinetic energy into electricity via a generator connected to the power grid. This process, now common in states like California, Iowa, and Texas, is a CO2-free way to generate power, currently supplying about 10% of electricity in the United States. “And I believe this can grow quite a lot,” he added; “in 20 years we could be deriving half of our electricity from wind power.” Meneveau considers wind energy potential as equal to solar, noting their complementary nature—wind is often stronger when it's less sunny, creating a beneficial synergy.
“Making society more sustainable from an energy point of view is really important to me, because we can't keep pumping CO2 into the atmosphere for another 100 years.”

Wind turbines under a blue sky with clouds.
“But of course,” he continued, “to make that happen we really do need to have improved models so that we can understand the incoming flow to a wind farm, and how the wind farm affects the flow itself and how it interacts with the atmosphere.”
Beyond wind farming, the model has other applications as well. It can aid in pollution prevention and control by predicting the movement of contaminants, smoke, or pollution plumes based on atmospheric conditions at various heights, including wind direction changes ("veer"). This capability can help determine safer emission locations and, by running the model backward with sensor data, pinpoint the source of pollution, enabling more effective intervention.
“It’s useful if you need to predict if there's a contaminant emission somewhere, or a plume of smoke for fires, or pollution—where does it go?” asked Meneveau. “How long will it take to get from point A to point B? You might use this information to emit the pollutant somewhere else where it can do less damage. All sorts of models exist, but as input, they need to know how the atmosphere looks at different heights, i.e. the wind spread vertical distribution.”
Leveraging Supercomputing Power
In their published work, the authors credit the high-performance computing assistance they received from supercomputer Cheyenne via NSF NCAR and CISL: the simulations provided the high-fidelity datasets with which the new theory could be compared in great detail. On this topic, Meneveau said:
“CISL is a national resource. It’s important to realize that these large-scale simulations, which involve moving eddies and turbulence, require supercomputing facilities—you can't do them on your laptop. They require hundreds to thousands of processors all working together and running for several days."
"It's an expensive enterprise," he continued. "There are a number of these supercomputing centers in the country. Some are bigger, some are smaller. As academic investigators at universities with our students, we need access to facilities that can run these simulations. CISL, associated with the National Center for Atmospheric Research (or NSF NCAR), has a supercomputing center. CISL opens up applications several times a year when you can write a research proposal saying, ‘Hey, I'm doing research in this area. I need two million hours of computing power for my NSF-supported research.’ They have committees that evaluate the proposals. Those are the facilities that we were using. So we ran the simulations that generated the raw data that we then analyzed for this paper.”
In relation to the CISL resources, Meneveau also discussed the utilization of very big data, “a theme that I find fascinating.” He stressed the importance of making the most of these resource-heavy large-scale simulations. “A lot of researchers nowadays run very expensive simulations,” he reflected. “Maybe they'll write one paper, they’ll conclude something interesting, they'll make some interesting observations, but then the data is gone, and they haven't proposed a simplifying description of it, so a lot of that effort is wasted. We try to counteract that to get as much out of it as possible by developing the reduced, simplified models.”
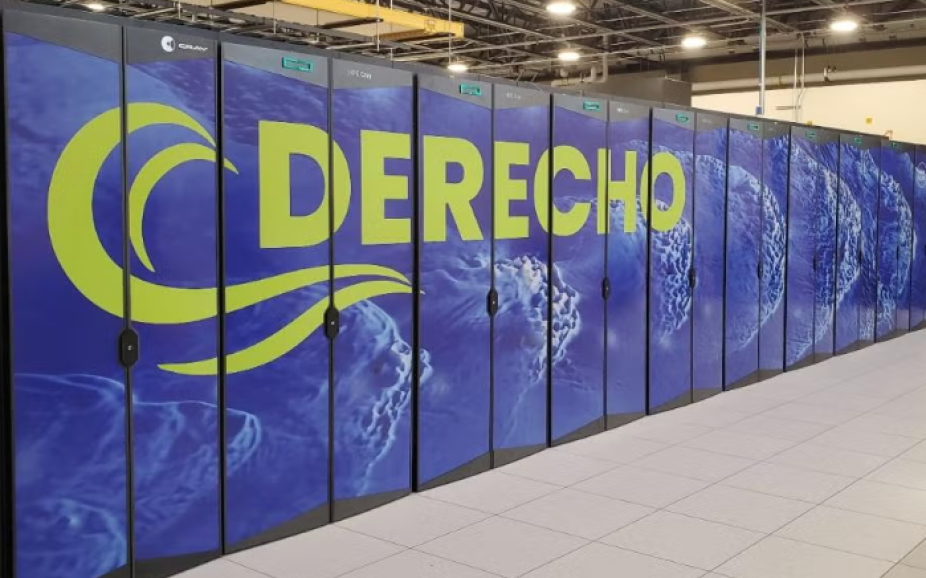
The Derecho system at NSF NCAR.
Another way? “Here at Hopkins we've focused on building large-scale databases from these simulations, called the Johns Hopkins Turbulence Database. We take the entire data and we store it and allow people to access the full data. It provides a lot and it's very easy to get to. You don't have to download big files and instead stream the data as you need it.”
He mentioned that two datasets in the database were generated by NSF NCAR scientists Peter Sullivan and Ned Patton. “And we're now in the process of putting in some wind farm data sets as well.”
Looking Ahead
“I have a new allocation at CISL to extend the work to off-shore wind energy issues," he said. "I'm very grateful it was approved." The study's lead author, former PhD student Dr. Narasimhan, is now a postdoctoral fellow pursuing related research questions at the University of Minnesota.
When asked about potential next steps, Meneveau responded: “It depends on the outcome of our current research. We go one step at a time. The next steps really need to be determined by whatever we find. And we don't know what we will find—it's research, after all.” He added:
“I consider myself a tiny little peg in a much bigger effort. I’m happy that we've been able to make some contributions to understanding some of the fundamental fluid mechanics involved and condensing that knowledge in a simple model.”
While the simple analytical model is a significant advance, the research team plans to continue refining it, incorporating additional factors like unstable atmospheric conditions and unsteady effects. However, even in its current form, this innovative research—with assistance from CISL’s computing power—should enable us to better understand and utilize wind dynamics.
Narasimhan G, Gayme DF, and Meneveau C. Analytical model coupling EKMaN and surface layer structure in atmospheric boundary layer flows. Boundary-Layer Meteorology. 2024;190(4). https://doi.org/10.1007/s10546-024-00859-9
This study was supported by the U.S. National Science Foundation under CBET-1949778, CMMI-2034111, and OAC-1920103.
Have a topic? Contact us. CISL News is seeking recently-published research using CISL resources. Email shiraf@ucar.edu.