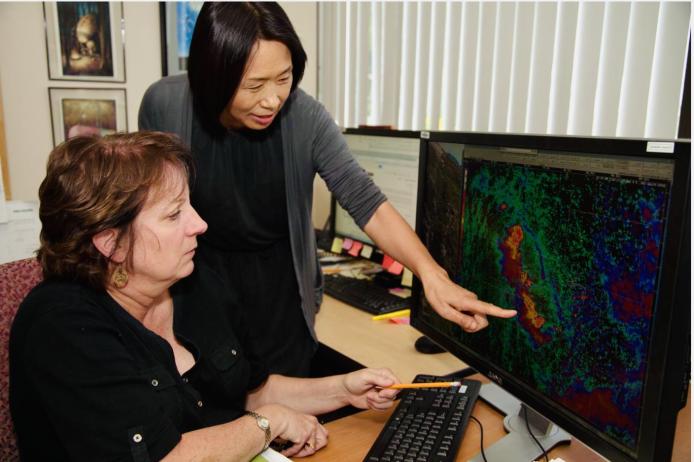
Understand and explain immense and complex data
We offer software tools, like GeoCAT and VAPOR, that help Earth systems scientists find the interesting nuggets in their data.
We also provide education, such as Project Pythia and online tutorials, to teach you how to use our software and services.
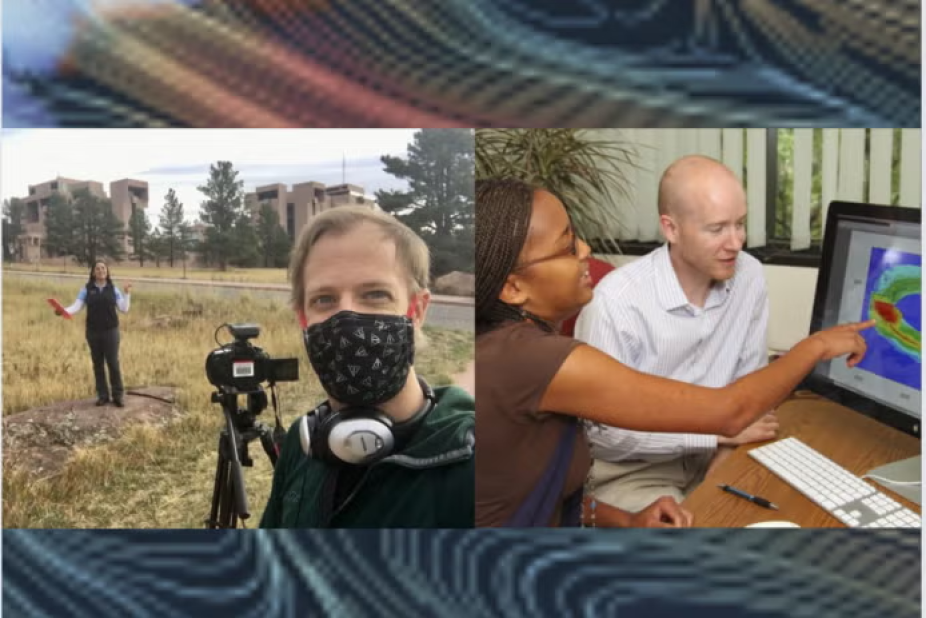
Share your data-driven insights through interactive visualizations
Show and tell your findings to the world.
We work at the intersection of science, engineering, design and communication to transform data into engaging, interactive experiences—such as YouTube videos, animations, infographics, and web interactives.
We work closely with scientists, educators, and communications pros to share your data findings with a larger audience.
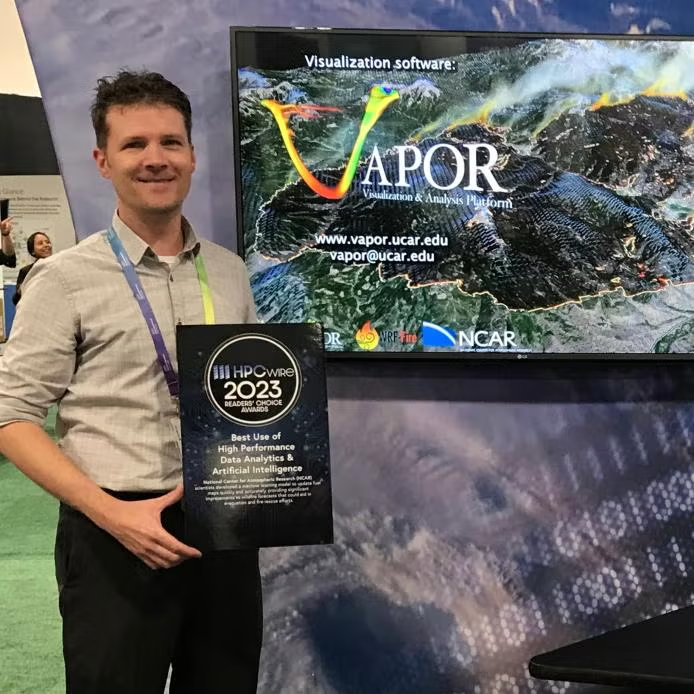
Research that pushes limits
Our research and development (R&D) teams are constantly improving analysis and visualization techniques through novel technologies:
- Data compression
- Augmented reality
- Virtual reality
- Cloud computing
- On-premise cloud environments